 English
Asia Pacific

Navigating your Store Performance Dashboard (part I)
Dashboards are an excellent tool for any business. By giving an at-a-glance view of an overall situation, they can help inform decision-making and focus efforts across the organisation. However, their effectiveness depends on how well they are designed.
At Optiseller we believe that leveraging data is the way forward for online sellers. That’s why we take our dashboards very seriously, beginning with our Store Performance Dashboard.
The Optiseller Store Performance Dashboard
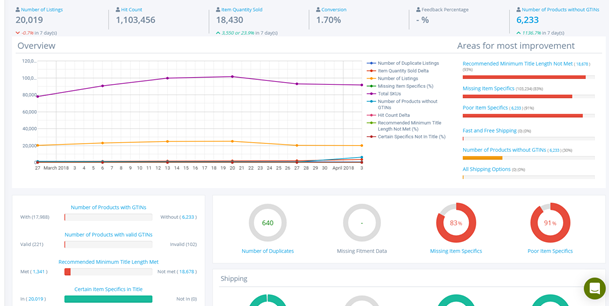
The Optiseller Store Performance Dashboard is designed to give online sellers an overview of their listings and help them identify where they need to make changes. If you want to improve your listing ratings, this dashboard is the perfect place to start.

The Dashboard tracks and offers insight into the following KPIs:
In our experience, these KPIs are the ones that provide the most value to business owners. Having said that, the tool is customisable, so you can change the KPIs displayed to suit your needs.
With all this information at your disposal, it can seem quite overwhelming at first to decide what to focus on. But fear not: in this short series, we will guide you through the tool and how to understand exactly what it is telling you. This way, you can make the most of the data we provide and get working on your store’s performance.
The headline figures
First, there are various stats such as your number of listings, amount sold, feedback percentage etc. These stats at the top of the screen are the headline figures.

Let’s talk about what they mean:
Number of listings – This is the number of active listings on the marketplace at the time of the data sample.
Hit count - The number of page views for the item.
Item quantity sold - The total number of items purchased so far (in the listing's lifetime). Conversion - Hit count divided by item quantity sold.
Feedback percentage - If available, the sellers feedback score.
Listings without GTINS - Any listings without product identifiers are shown here.
The graph
Right beneath the headline figures, you will see the graph, which shows several counters for comparison purposes.
The graph is interactive: items can be shown and hidden by clicking on the item within the legend area. This can be useful when comparing trends; for example, Item Quantity Sold Delta vs Listings without GTINs.

Number of duplicates KPI
eBay policy states that sellers can't have more than one fixed price listing of an identical item at the same time. You risk getting penalised if you don't abide by this policy, so our advice is to take duplicates seriously.
To make things easy for you, our dashboard includes a duplicate KPI. The indicator gives you a high-level view on potential items falling foul of this policy, and to view the detail behind the duplicates.
More specifically, the dashboard shows a total of items with an exact match on title and site. If you subscribe to the duplicate listings tool, the dashboard total will automatically be based on duplicates – a combination of title, site and EAN. This can be very handy when you are managing hundreds or thousands of listings.
Check out the second post in this series here and the final post here for more guidance on your Store Performance Dashboard.
For additional information on listings and GTINs, take a look at our help article Listings & GTINs | Optiseller Help Center
Find out more about item specifics Optiseller : Types of eBay Item Specifics
Check out our November updates to see what's new in our Aspect Finder + tool Optiseller : Optiseller Aspect Finder+ product updates November 2020